In this article
From completed workflows to lower cost per accepted outcome, higher capacity, and auditable returns.
A Series B software company is processing 800 quote-to-order requests each month. Sales brings the deal forward. Revenue Operations verifies the commercial terms, checks CRM and billing records, resolves exceptions, sends approvals to the right owner, and produces an accepted order record.
Demand is growing to 1,200 requests a month. The existing team is already busy. The COO can add a specialist—or implement a workflow that handles the repeatable steps, routes exceptional cases to humans, and records exactly what happened.
The buying decision is not about how many AI tasks execute. It is about how much more verified work the organization can complete for each dollar and each hour of human effort.
That is measurable operating leverage.

The Result to Purchase: Accepted Output per Operating Dollar
A useful automation scorecard follows a business transaction all the way to its accepted conclusion. For this example, the unit of output is one accepted quote-to-order record. It must contain the correct customer, approved price and terms, billing entity, authorized approver, and traceable record in the system of record.
A draft order is not an accepted order. A model response is not an accepted order. A successful API call is not an accepted order. The business gets the value when the required record is accurate, approved, and available to the downstream team.
OMEGANEON would measure five dimensions together:
| Measurement layer | Primary metric | Where the evidence comes from |
|---|---|---|
| Output | Accepted cases per month | Verified end-state records, acceptance IDs |
| Capacity | All-in human touch minutes per accepted case | Work-event logs, review and exception timestamps |
| Economics | Operating cost per accepted case | Loaded labor rate, workflow service and usage ledger |
| Reliability | Defect/reopen rate, p90 cycle time, SLA achievement | QA sampling, process events, exception register |
| Financial realization | Approved hiring avoided, overtime/contractor spend retired, paid revenue enabled | Finance-approved budgets and actual expense records |
The most useful dashboard is the one that puts these metrics beside each other. More tasks per minute mean little if exceptions grow, approvals are bypassed, or a human team spends the saved time repairing outputs.
What public evidence gives us
In June 2026, the U.S. Bureau of Labor Statistics reported $75.97 in employer compensation per hour worked for the professional, scientific, and technical services industry, comprising $51.88 in wages and salaries and $24.10 in benefits (published components subject to rounding). The broader private-industry average was $46.89. This provides a documented cost benchmark for converting labor time into an economic model. [1]
A 2025 field study in The Quarterly Journal of Economics, covering 5,172 customer-support agents, recorded an average 15% improvement in issues resolved per hour when agents received access to a generative-AI assistant. That is measured productivity in an actual workplace setting. [2]
For the quote-to-order process below, the touch-time changes are scenario assumptions, tested against a process-specific baseline. The study is evidence that operational productivity can be measured; the customer's own workflow logs determine the actual result.
The Worked Case: 50% More Orders, Fewer Human Hours
Hypothetical scenario. The company currently completes 800 accepted orders per month at an all-in average of 18 human minutes each. Forecast demand is 1,200 orders per month—a 50% increase. The future automated workflow targets seven human minutes per accepted order, including review, rework, and exception handling.
To keep the example auditable, use a rounded $75 per worked hour as the labor-cost proxy, close to the BLS industry average above. This is an illustrative costing assumption, not a quoted employee salary.
| Operating measure | Current baseline | Scale manually | Scale with workflow |
|---|---|---|---|
| Accepted orders / month | 800 | 1,200 | 1,200 |
| Human touch minutes / order | 18 | 18 | 7 |
| Human time / month | 240 h | 360 h | 140 h |
| Allocated labor cost / month, at $75/h | $18,000 | $27,000 | $10,500 |
| Managed workflow + API / infrastructure per month | $0 | $0 | $5,500 |
| Total modeled monthly economic cost | $18,000 | $27,000 | $16,000 |
| Cost per accepted order | $22.50 | $22.50 | $13.33 |
All company inputs, workflow performance, service prices, and delivery timing in this case are hypothetical. The model compares equal accepted output (1,200 orders) in the two future alternatives.
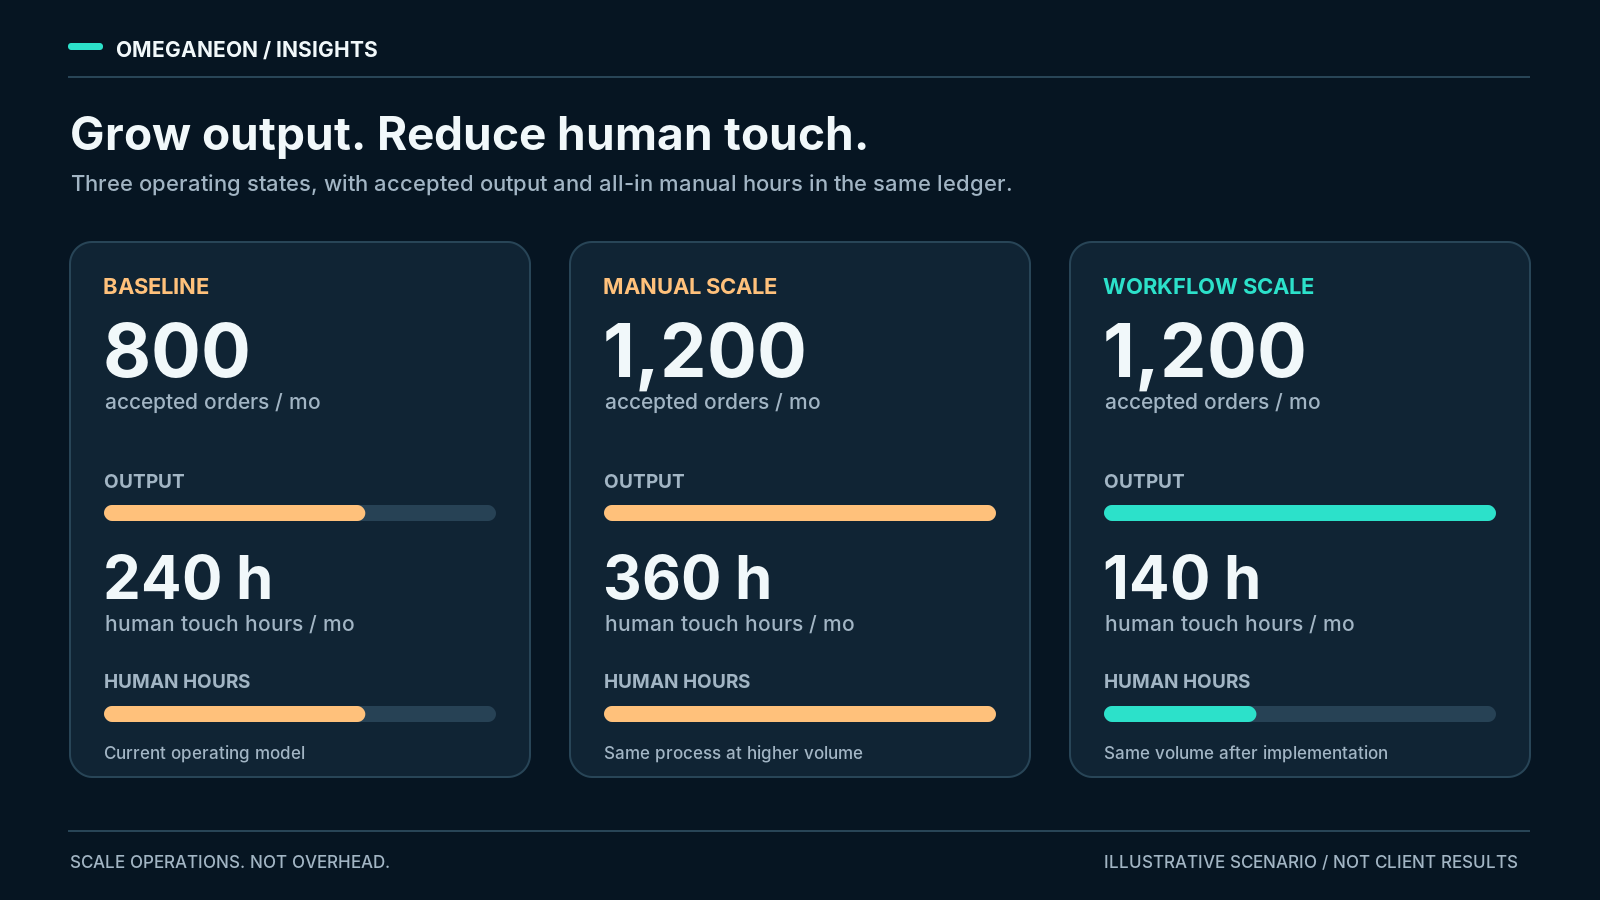
The workflow design is specific: capture an incoming quote; reconcile customer and order fields against the CRM and billing source; apply explicit commercial rules; ask a human for any out-of-policy change; create the approved record; notify the owning team; and log the outcome. Retry policies and exception queues preserve the work if an integration fails.
The financial impact comes from the removal of repetitive retrieval, comparison, routing, and record-updating actions. Human work remains for interpretation, exceptions, and authorization.
Unit Economics: The Operating Leverage Effect
At 1,200 accepted orders per month, manual execution requires 360 human hours. The modeled workflow requires 140. That is 220 hours of human capacity released per month—or 1.375 equivalents of a 160-hour month. This is a capacity measure, not an employee-reduction claim.
The 220 hours carry a modeled labor value of 220 × $75 = $16,500 per month. After the hypothetical $5,000 monthly Managed Operations fee and $500 monthly API/infrastructure allocation, net economic capacity value is $11,000 per month.
At the same 1,200-order volume:
- Manual unit economic cost:
$27,000 / 1,200 = $22.50. - Workflow unit economic cost:
$16,000 / 1,200 = $13.33. - Difference:
$9.17 per accepted order, or 40.7% lower modeled unit cost. - Annualized steady-state economic difference:
$11,000 × 12 = $132,000.
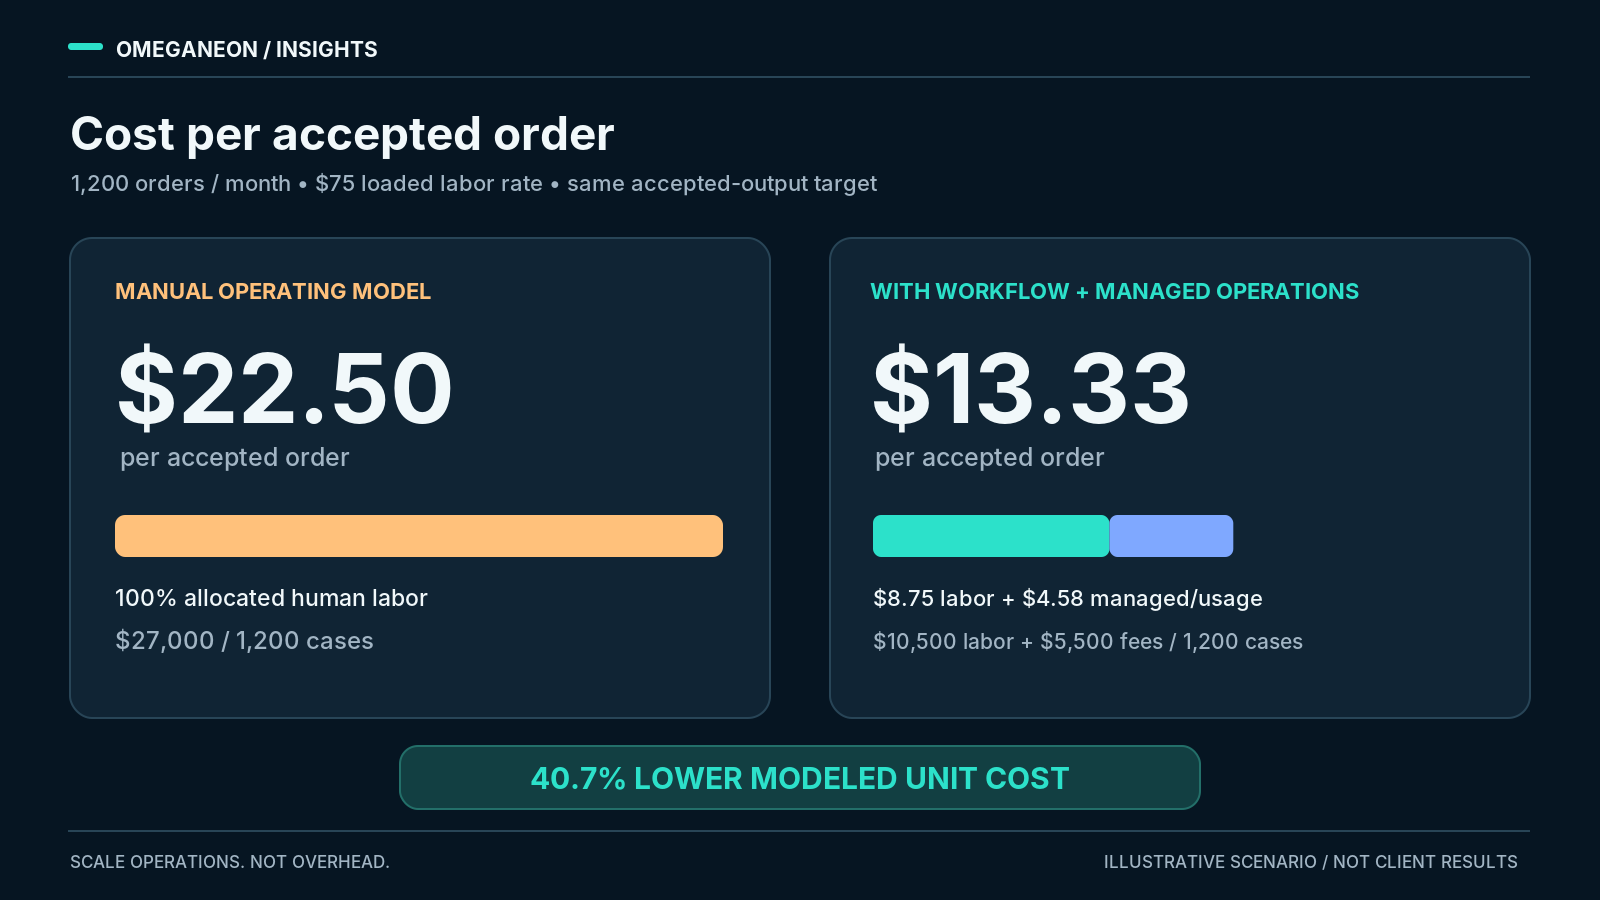
Compare this with today's baseline as well: output grows 50%, from 800 to 1,200 orders; modeled monthly operating cost changes from $18,000 to $16,000. Accepted output per modeled operating dollar rises 68.8%. This is what scalable operating leverage looks like in a ledger: more business volume without matching growth in the process's allocated operating cost.
A first-year implementation schedule
One-time implementation is assumed at $10,000. During months 1–2, the business uses the manual process while design, testing, permissions, and production approvals are completed. Both alternatives are assumed to use identical interim overflow coverage for the 1,200-case target; this common effort is included in the allocated manual hours on both sides. The workflow goes live in month 3 and reaches the modeled steady state for months 3–12.
| 12-month comparison | Scale manually | Implement + manage workflow |
|---|---|---|
| Months 1–2 | $54,000 | $54,000 |
| Months 3–12 | $270,000 | $160,000 |
| One-time setup | $0 | $10,000 |
| Total modeled economic cost | $324,000 | $224,000 |
| First-year modeled economic difference | $100,000 |
The recurring economic break-even is reached when the workflow saves more than 3.67 human minutes per accepted order at 1,200 orders per month and $75 per hour. In this model, the expected reduction is 11 minutes. The one-time setup recovers its modeled economic value in about 0.91 live months at the target performance level.
The first-year $100,000 is an economic capacity valuation that assumes released hours are redeployed into equally valuable productive work. Without that redeployment, the measurable gain is time and available capacity—not $100,000 of realized financial value. It is not automatically a reduction in salary cash outflows. That distinction leads to a separate financial question.
Explore the unified operational economics model in Scale Operations. Not Overhead. for the complete investment framework behind this analysis.
Two Ledgers: Capacity Created and Cash Actually Retained
An organization can release 220 productive hours and keep every employee. The staff may use the new capacity to shorten queues, support growth, improve contract quality, or work on revenue-generating tasks. That is operational value.
The cash ledger asks a different question: Which budget line will no longer be paid? For example, management may cancel a signed-off hiring plan, reduce contractor invoices, end an overtime premium, or retire duplicated software spend. Each requires a finance-verifiable event.
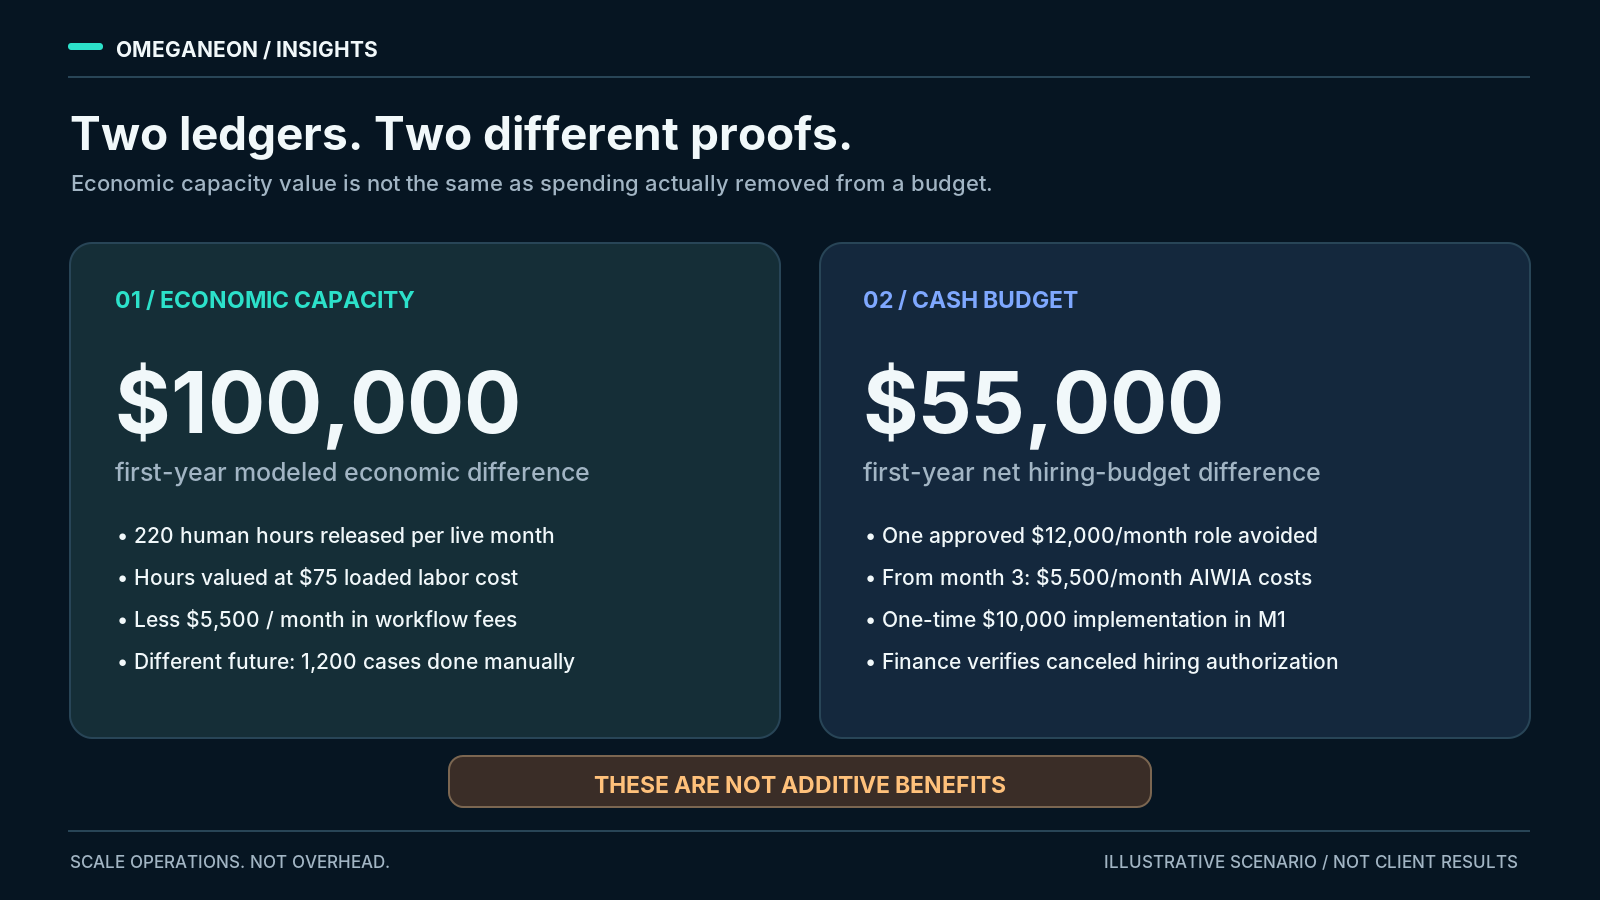
Consider a second, separate hypothetical cash scenario. To cover the growth from 800 to 1,200 orders without automation, Finance has already approved one additional operations role beginning in month 3. At a modeled 160 hours per month and $75 fully loaded per hour, that role has an allocated budget of $12,000 per month.
Instead, the company implements the workflow. From month 3, it avoids that planned hiring expense and pays $5,500 per month for managed workflow and usage. The $10,000 production implementation cost occurs in month 1.
- Avoided hiring spend, months 3–12:
$12,000 × 10 = $120,000. - Incremental Managed Operations + usage, months 3–12:
$5,500 × 10 = $55,000. - One-time implementation:
$10,000. - First-year modeled net incremental cash budget difference: $55,000.
- Monthly net budget difference after go-live: $6,500.
- Setup cost recovered after approximately 1.54 live months, assuming the approved hire would otherwise have been made.
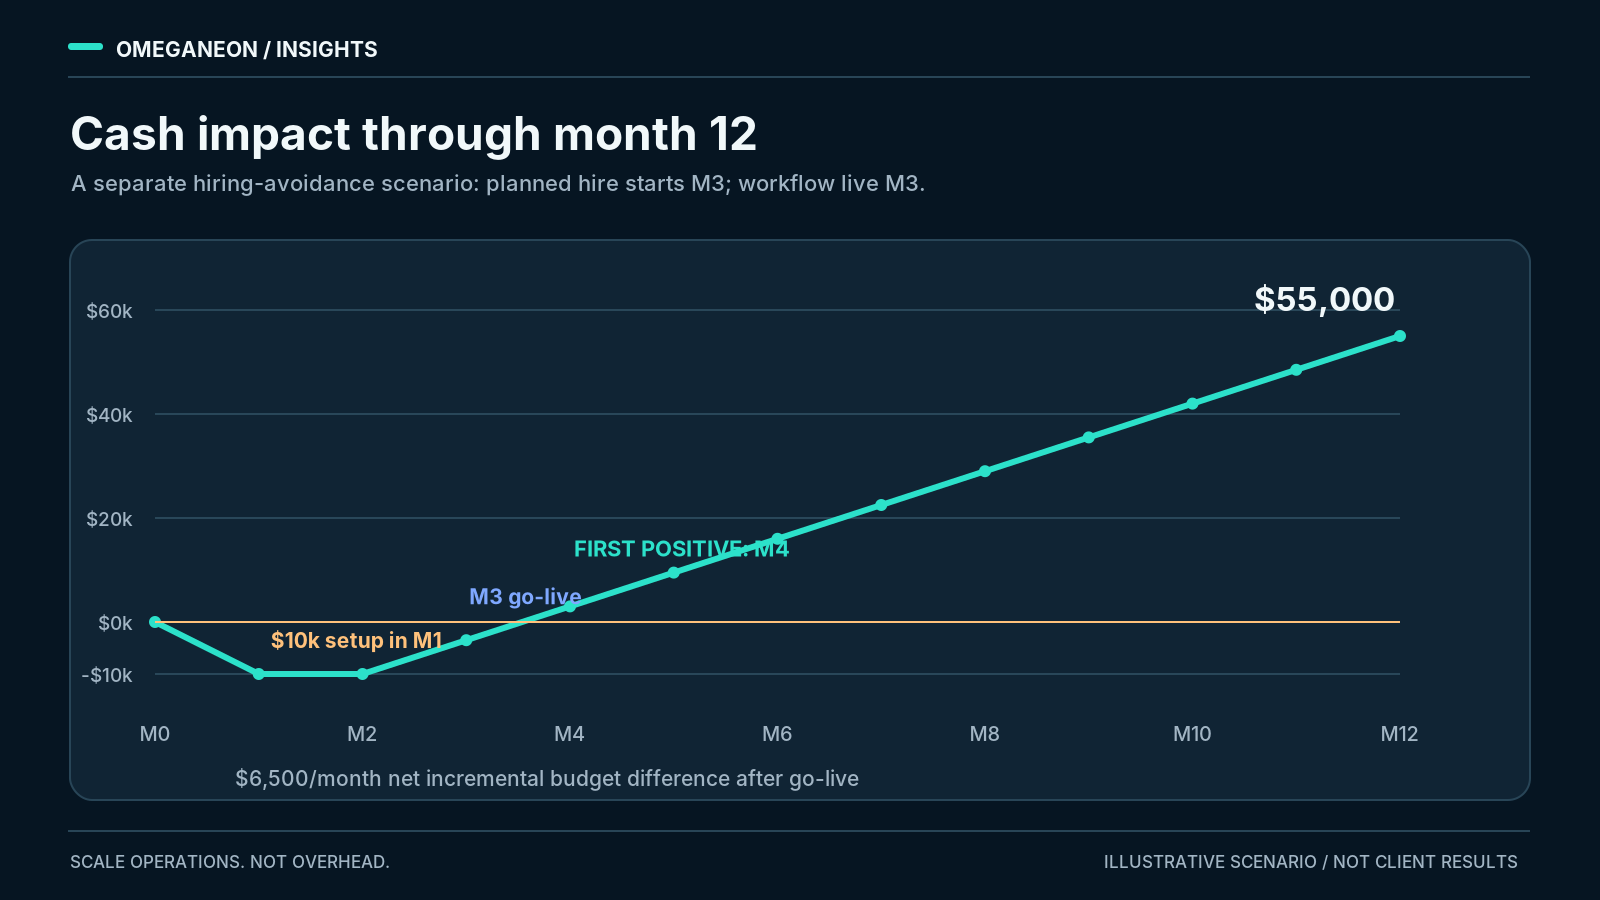
The $55,000 cash scenario and the $100,000 economic scenario are two views of the same modeled workflow, not additive benefits. A finance owner should select the ledger aligned with the real baseline and record the decision that converts capacity into a change in spending.
If a hire was never budgeted, the relevant cash benefit is not an avoided salary. The operational result can still be strong: the existing team completes more accepted work without increasing headcount.
What the Workflow Must Record to Prove It
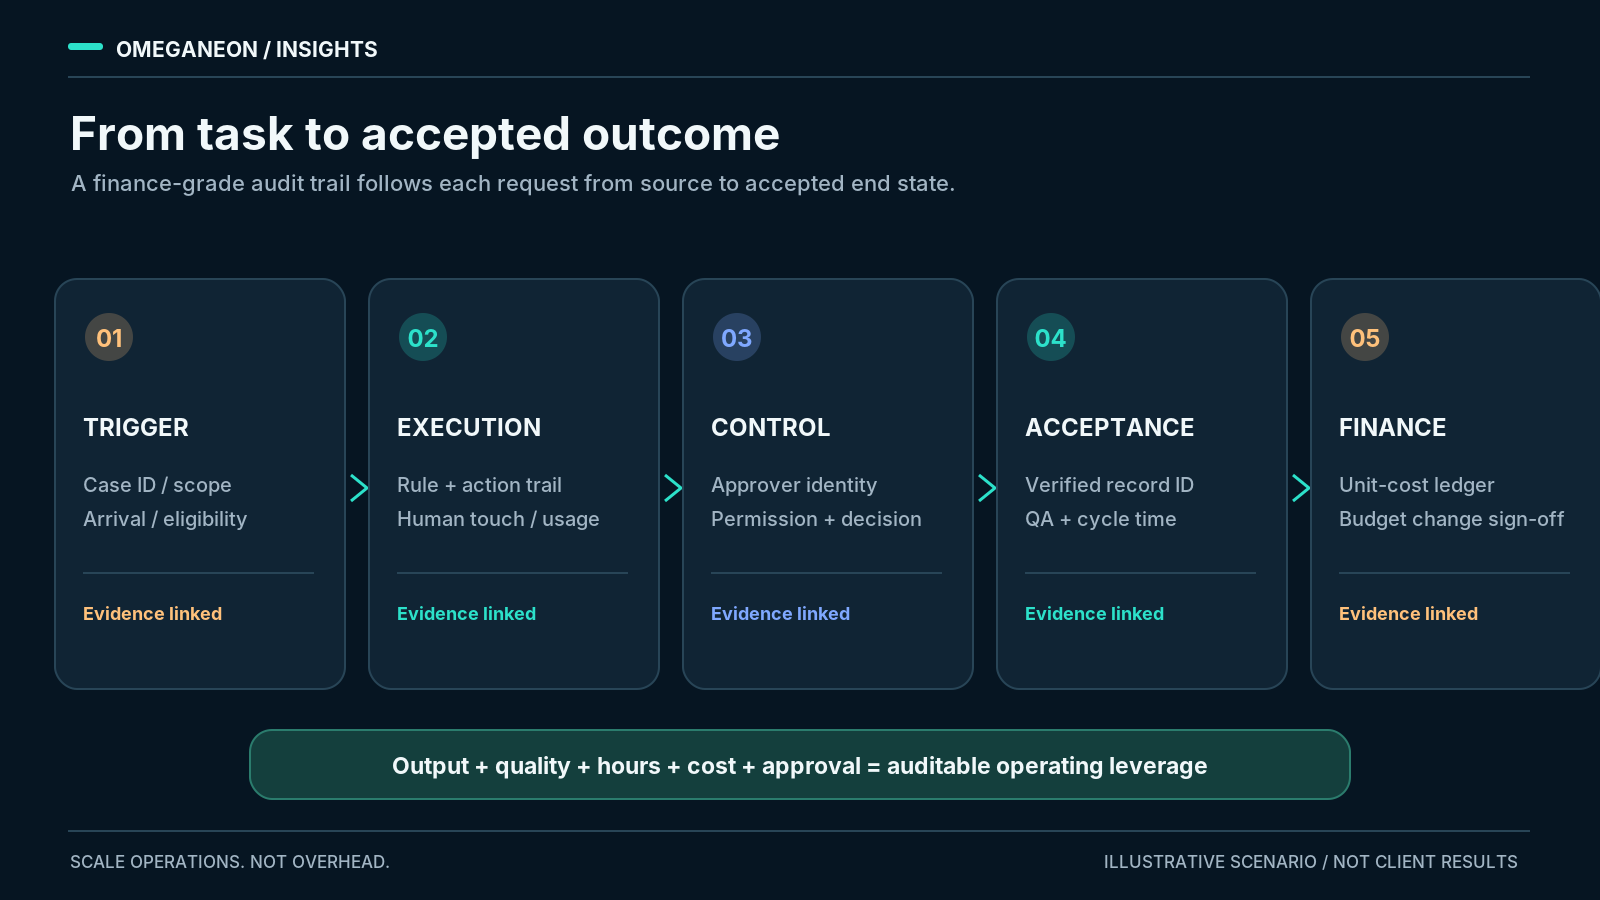
A monthly ROI slide needs more than an automation dashboard. It needs a measurement trail from the business request to the accepted result.
Each work item should carry a stable case identifier and the minimum evidence needed to reconstruct the outcome:
- Trigger and scope. Case ID, customer/account reference, request source, eligibility rules, arrival timestamp, workflow version.
- Action and cost. Human start/stop events; automated steps; usage ledger; approved data sources; retry and exception counts.
- Decision control. Business rule applied, data version, authorization scope, approver identity, approval/denial timestamp.
- Accepted outcome. Order record ID, independent validation status, completion timestamp, reopen/defect status.
- Financial mapping. Loaded labor cost version, recurring vendor expense, approved budget item actually changed, finance sign-off.
The workflow has to stop or route to a person for exceptions outside its authorized scope. This design follows the practical logic of the National Institute of Standards and Technology's AI Risk Management Framework: Govern, Map, Measure, Manage risk across the AI lifecycle. [3] Applied here, that means documented permissions, measured quality, monitored behavior, and an owner who can suspend or correct the workflow.
An automation completion log becomes valuable when it is linked to the human-reviewed, accepted business record. That pairing supports a defensible operating-cost model and a clear implementation acceptance test.
A Measurement Plan for the First 90 Days
Start with four weeks of baseline instrumentation. Record all-in human touch time, initial-to-accepted cycle time, volume, defect/reopen reasons, approval steps, and p90 completion time. Use accepted cases as the denominator and retain their workflow mix—routine, complex, and exception-heavy.
During implementation, replay a representative sample in an authorized sandbox. Fix data permissions and routing rules. Put the automated result beside the manual result, including human correction time. Validate outputs with the designated business owner. No customer production action is authorized merely because a pilot simulation passes.
When formal production approval is granted, use a staged rollout with a clean comparison window. Review process data weekly and a finance ledger monthly. A workable acceptance sheet for this hypothetical quote-to-order workflow would be:
| Acceptance dimension | Example target to agree in the SOW |
|---|---|
| Monthly volume | Capacity for 1,200 eligible orders |
| Human touch time | ≤7.0 minutes / accepted order, all-in |
| Correctness | QA defect rate ≤2% |
| High-risk approvals | 100% completed by authorized humans |
| Unauthorized high-risk actions | Zero |
| Traceability | 100% of accepted cases have IDs and approval records |
| Operational stability | SLA and p90 cycle time meet the customer-defined threshold |
These are proposed acceptance thresholds, not observed OMEGANEON customer results. A workflow that lowers touch time but misses authorization or quality gates is not accepted.
A monthly outcome report should contain four sections: volume and quality, employee hours and cost per accepted case, vendor and exception costs, and realized budget changes. For each benefit, show owner, source record, baseline period, measured period, and reconciliation status.
What Makes the Improvement Persist
An initial implementation captures a point-in-time operating improvement. Long-term leverage requires changes to remain reliable as customer volume, policy, and integrations evolve.
Managed Operations should monitor queue aging, business-rule drift, failed integrations, exception volume, retried actions, and versioned approvals. When a CRM schema changes or a pricing rule is amended, the workflow should be updated, tested, and reapproved under the agreed change process.
This creates a commercial distinction between a tool that runs once and an operating system that continues delivering accepted outcomes. The second is what justifies continuing managed-service expense: maintained capacity, controlled risk, and measured process economics.
For adjacent workflows, the same measurement method can support new implementations—onboarding, renewals, support escalation, SDR operations—without pretending that all of them have the same starting costs or automation potential. Each gets its own baseline, acceptance criteria, and finance realization ledger.
From Business Case to Implementation
OMEGANEON starts by identifying a high-friction workflow and mapping its actual inputs, permissions, exceptions, and accepted business output. The discovery process quantifies baseline volume, manual effort, and operating constraints before implementation scope is finalized.
The standard $4,000 / 4-week Paid Pilot is an option for a bounded, contract-defined workflow in an authorized sandbox with agreed evidence and acceptance criteria. Pilot scope and subsequent commercial credits are governed by the signed terms. Production implementation and ongoing Managed Operations are separately approved under the applicable formal engagement and go-live controls. The $10,000 setup and $5,000/month Managed Operations amounts in the scenario above are illustrative financial inputs, not a published fixed price or an automatic pilot conversion.
The deliverable should be a workflow whose business rules, approved actions, exceptions, acceptance test, and operating results can be reviewed—not simply a generated diagram or a demo video.
Find the workflow. Establish the baseline. Measure the operating leverage. Put the result into operation.
Start a conversation with OMEGANEON to identify the first workflow, scope its measurement plan, and price the implementation against your actual operating data.
Sources and modeling notes
[1] U.S. Bureau of Labor Statistics, Employer Costs for Employee Compensation, June 2026 (released September 9, 2026): industry series and ECEC release.
[2] Erik Brynjolfsson, Danielle Li, Lindsey Raymond, Generative AI at Work, The Quarterly Journal of Economics 140(2), May 2025, pp. 889–942: publisher / DOI.
[3] U.S. National Institute of Standards and Technology, AI Risk Management Framework 1.0, 2023: AI RMF Core.
Model status: every company-specific volume, touch-time reduction, staff budget, workflow charge, rollout date, and financial result in this article is hypothetical. The public figures above are source research. See calculation notes in the publication package for formulas and cash/economic separation.
Put One Workflow Into Operation
Start a Paid Pilot — $4,000 · 4 weeks · One workflow.
Get a Workflow Assessment to define the implementation scope, acceptance criteria and Managed Operations plan.
Fund operating capacity with a clear investment case.
Compare full operating costs, multi-workflow economics, workforce transition paths and financial sensitivity—then set the evidence gates for implementation.
Build better operations.
Keep learning.
Practical research on AI workflows, operating costs, and scaling startup operations. Delivered by email.
The subscription form loads as you reach this section.
See the framework. Explore the work.
Agent Permission Boundaries, Human Approval & Audit Logs
Review the six APB permission primitives, human oversight and auditability used to bound business-system access.
Read the frameworkWHITEPAPERScaling, Just Like Drag-and-Drop.
Connect operating economics with implemented workflows and verifiable engineering evidence.
Read the frameworkRELATED CASE STUDY / START HEREERP Document Operations: From Manual Documentation to Managed AI Workflows
Review measured document execution, deterministic QA and human approval evidence.
Explore the case studyRELATED CASE STUDYScaling Creator Monetization Without Scaling Operational Work
Explore implemented customer lifecycle and revenue operations workflows.
Explore the case studyRELATED CASE STUDYAI-Powered Government Contract Opportunity Discovery & Qualification
See source-linked research, qualification rules and controlled review workflows.
Explore the case study