06 — Measured Outcomes
OMEGANEON benchmarked the ERP Document Operations workflow using a standardized validation suite of multi-source project inputs, including discovery transcripts, requirement matrices, and Statement of Work templates.
The engineering validation measured automated document-production time, deterministic QA, first-pass validation, exception handling, and inference cost.
Business Outcomes — Four Dimensions
The outcome dashboard connects engineering performance to business operations across human work, qualified output, unit economics, and operational transferability. The figures below distinguish measured sandbox evidence from scenario-based calculations.
Human Hours Saved — Transparent Calculation
An illustrative 30-minute human-review allowance is used to model post-automation active work for a document that passes first validation. Both routes are compared at the QA-checked, review-ready document checkpoint; commercial approval waiting time is excluded.
Manual active Draft + QA estimate:       125–215 min / SOW
Post-automation human handling scenario: 30 min / first-pass SOW
Modeled active human time released:      95–185 min / first-pass SOW
                                       = 1.58–3.08 hours / SOW
Actual human hours saved will be calculated from timed review, clarification, rework, and approval activity. The 3 of 20 missing-input exceptions are not assumed to require zero human time.
QA-Qualified Document Throughput — Qualified Outputs, Not Just Runs
The sandbox test recorded 17 first-pass-validated document packages out of 20 attempts. A sequential machine-capacity scenario applies that observed pass ratio to the measured 2.5–4.5-minute Draft + QA runtime:
Gross machine processing capacity = 60 / runtime
                                  = 13.3–24.0 attempted packages / hour
Modeled first-pass qualified rate = gross capacity × (17 / 20)
                                  = 11.3–20.4 packages / machine-hour
This is an indicative machine-only calculation. Measured live throughput must include input availability, exceptions, retries, review capacity, and delivery constraints.
Cost per QA-Qualified Document — Inference Economics
For comparable package attempts, dividing the measured API-cost range by the observed first-pass yield gives a transparent first-pass output cost model:
Lower scenario = $0.25 / 0.85 = $0.29 per QA-passed package
Upper scenario = $0.65 / 0.85 = $0.76 per QA-passed package
This is a derived inference-cost estimate, not an observed fully loaded cost per delivered SOW. Actual managed-service unit economics also include operator review, failed/reworked attempts, infrastructure, and ongoing support.
Operational Transferability — From Individual Know-How to Operable Workflows
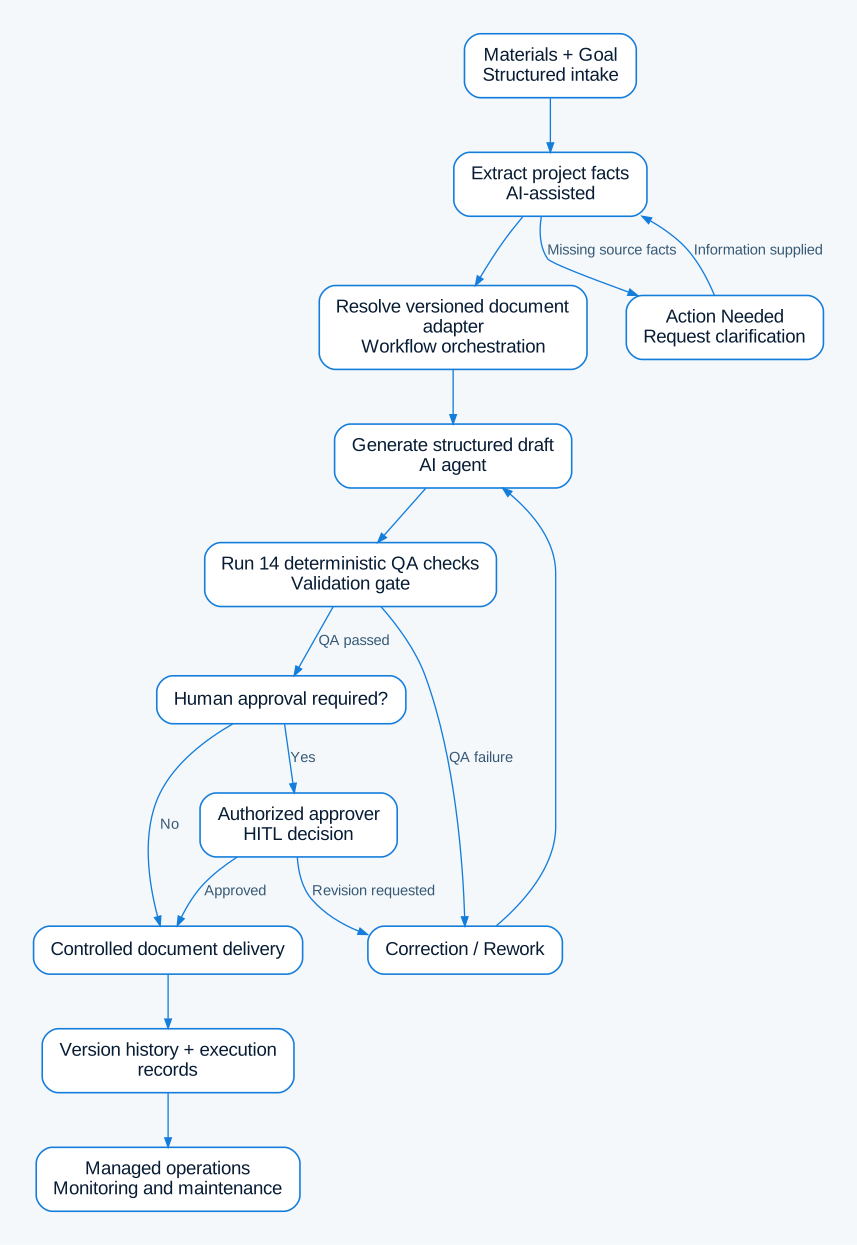
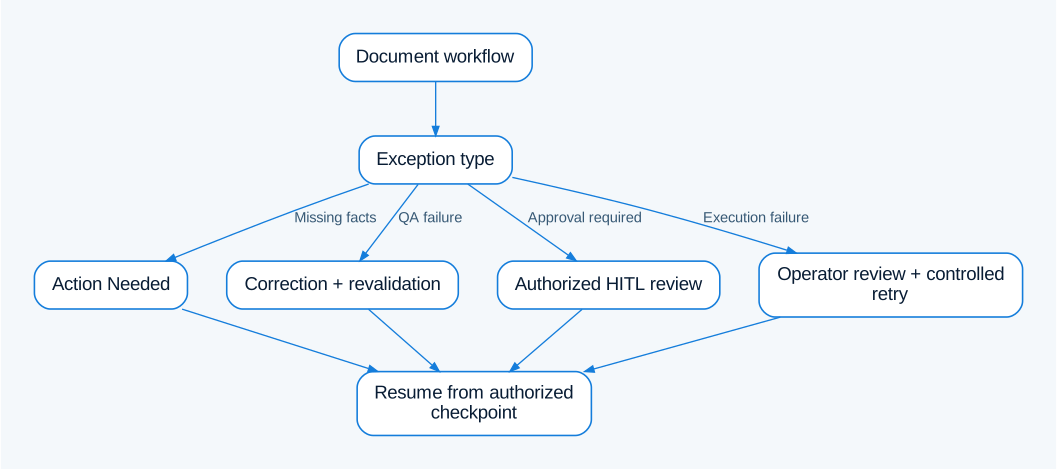
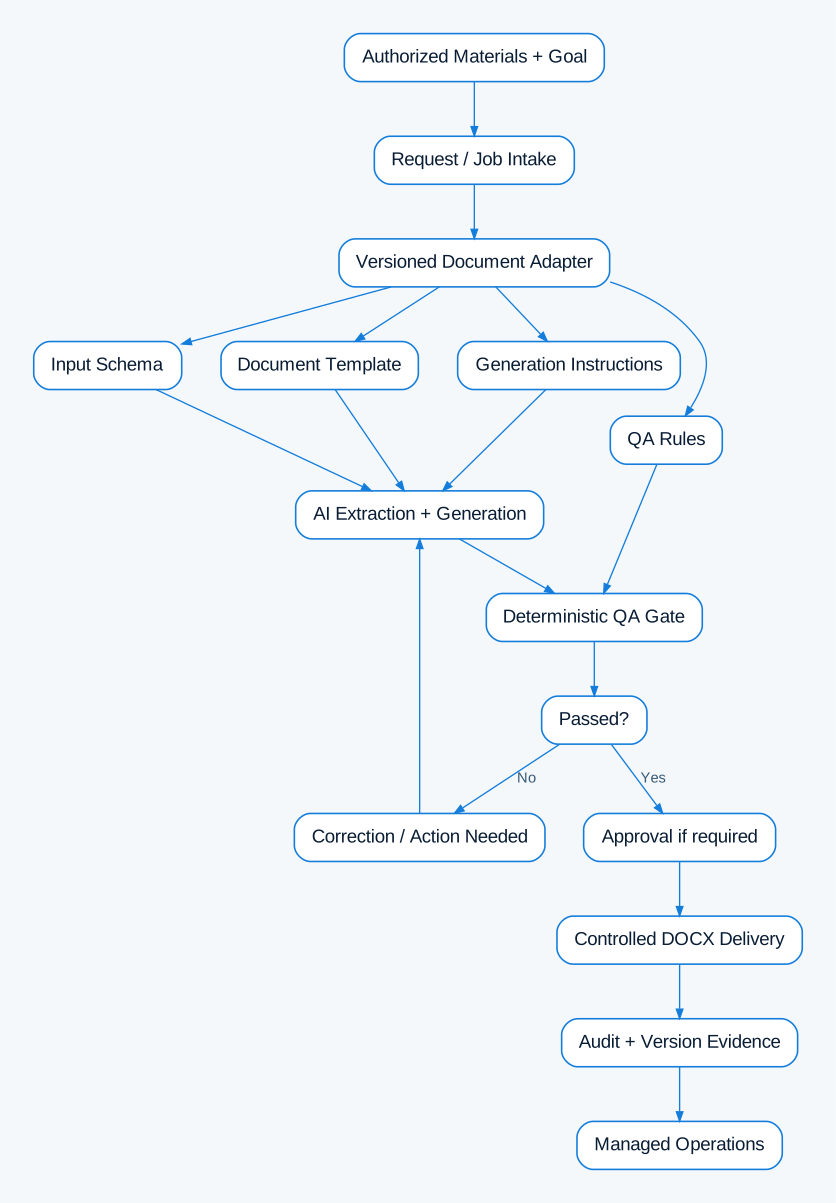
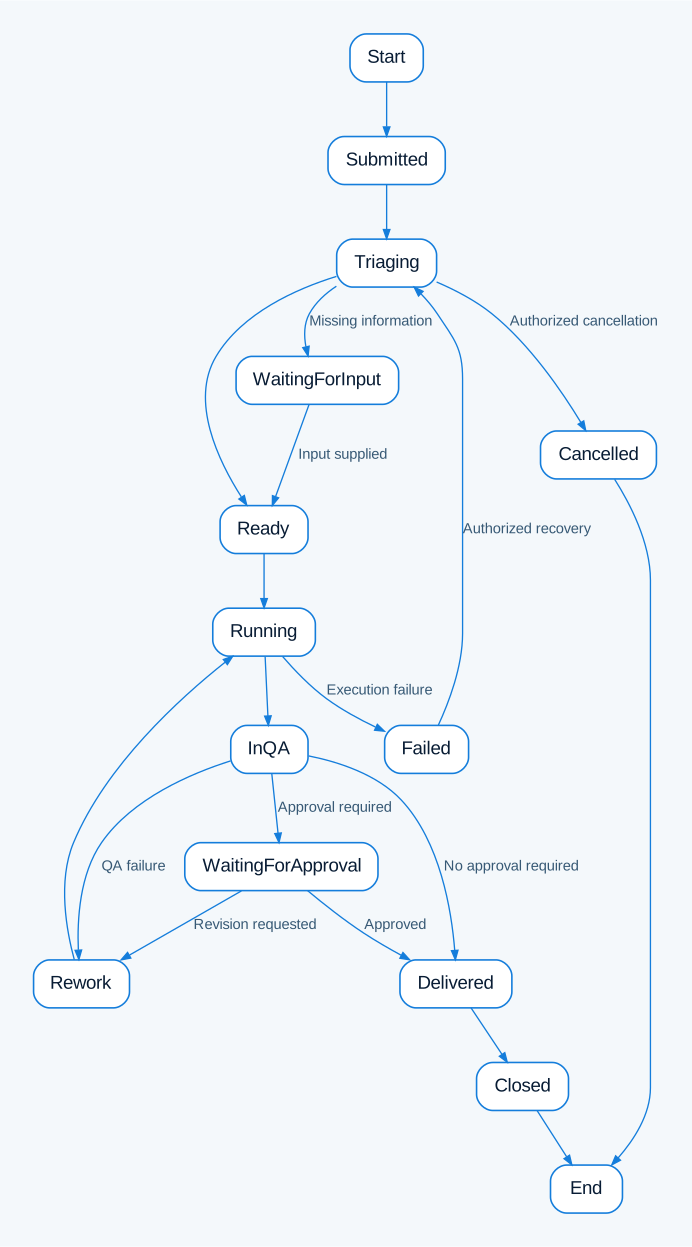
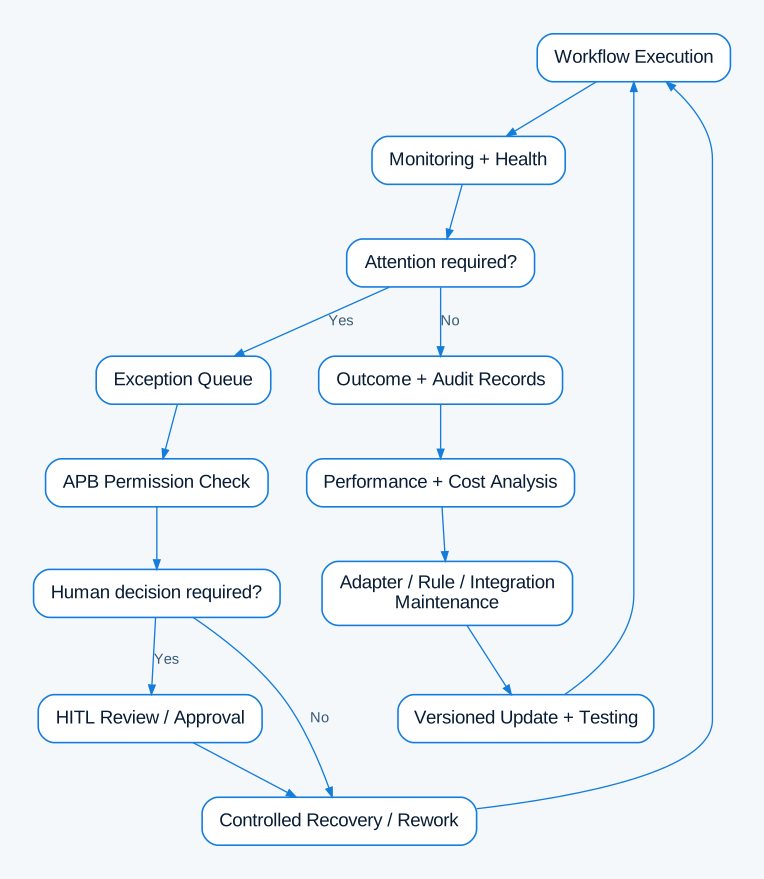
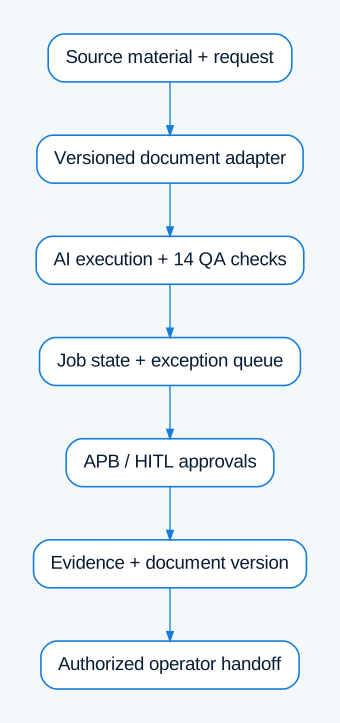
The workflow packages repeatable execution into versioned document adapters, deterministic QA rules, documented job states, scoped APB permissions, HITL decisions, and audit-linked deliverables. Work can be assigned and reviewed using shared process definitions rather than relying solely on one consultant's memory.
Open full workflow diagram
Transferability acceptance measure: A different authorized operator should be able to locate the active job, its source evidence, adapter version, exception history, and next permitted action, then complete the handoff using those records. A timed, cross-operator handover benchmark is not part of the current sandbox measurements.
6.1 — Engineering Benchmark Results
6.2 — Automated Document Processing Time
2.5–4.5 minutes
Recorded machine runtime covers intake, AI-assisted extraction, document generation, and deterministic QA. Human approval turnaround is measured separately from machine processing.
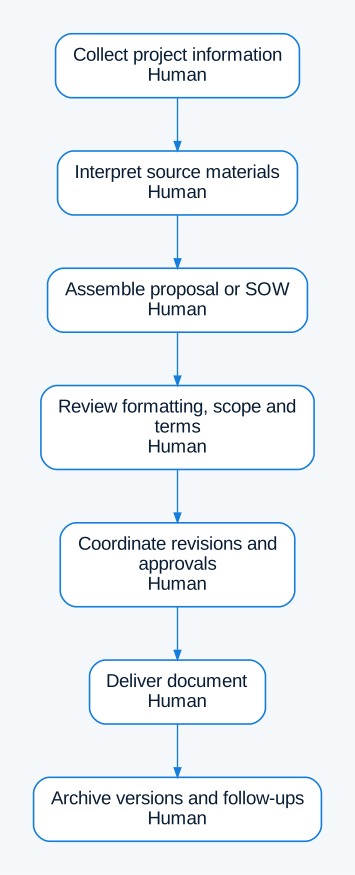
6.3 — Estimated Manual Baseline: Step-by-Step Task Decomposition
125–215 minutes (2 hours 5 minutes to 3 hours 35 minutes) of estimated active manual work per SOW package. The midpoint of the modeled range is 170 minutes (2 hours 50 minutes).
This estimate is calculated bottom-up, not selected in advance. It uses a time-motion, GOMS-inspired task-level decomposition of seven distinct manual actions. Each range is a reasoned planning estimate, not a measured consultant average.
Fixed scenario: One medium-complexity ERP implementation SOW, prepared by a consultant familiar with the engagement. Inputs are already available: discovery notes/transcripts, a requirements matrix, and an existing SOW template. Pricing assumptions and project decisions are documented in the supplied materials; no fresh discovery workshop or new legal negotiation is required.
Comparable boundary: Both routes start when the same source package becomes available and stop at an internally QA-checked draft ready for an authorized human review/approval step. Neither route includes human approval waiting time, signatures, later client revisions, or delivery.
Calculation — sum of steps, with no preselected total:
LOW  = 5 + 25 + 15 + 35 + 15 + 20 + 10 = 125 min = 2h 05m
HIGH = 10 + 40 + 30 + 55 + 25 + 35 + 20 = 215 min = 3h 35m
MIDPOINT = (125 + 215) / 2 = 170 min = 2h 50m
Manual Task Flow vs. Automated Draft & QA
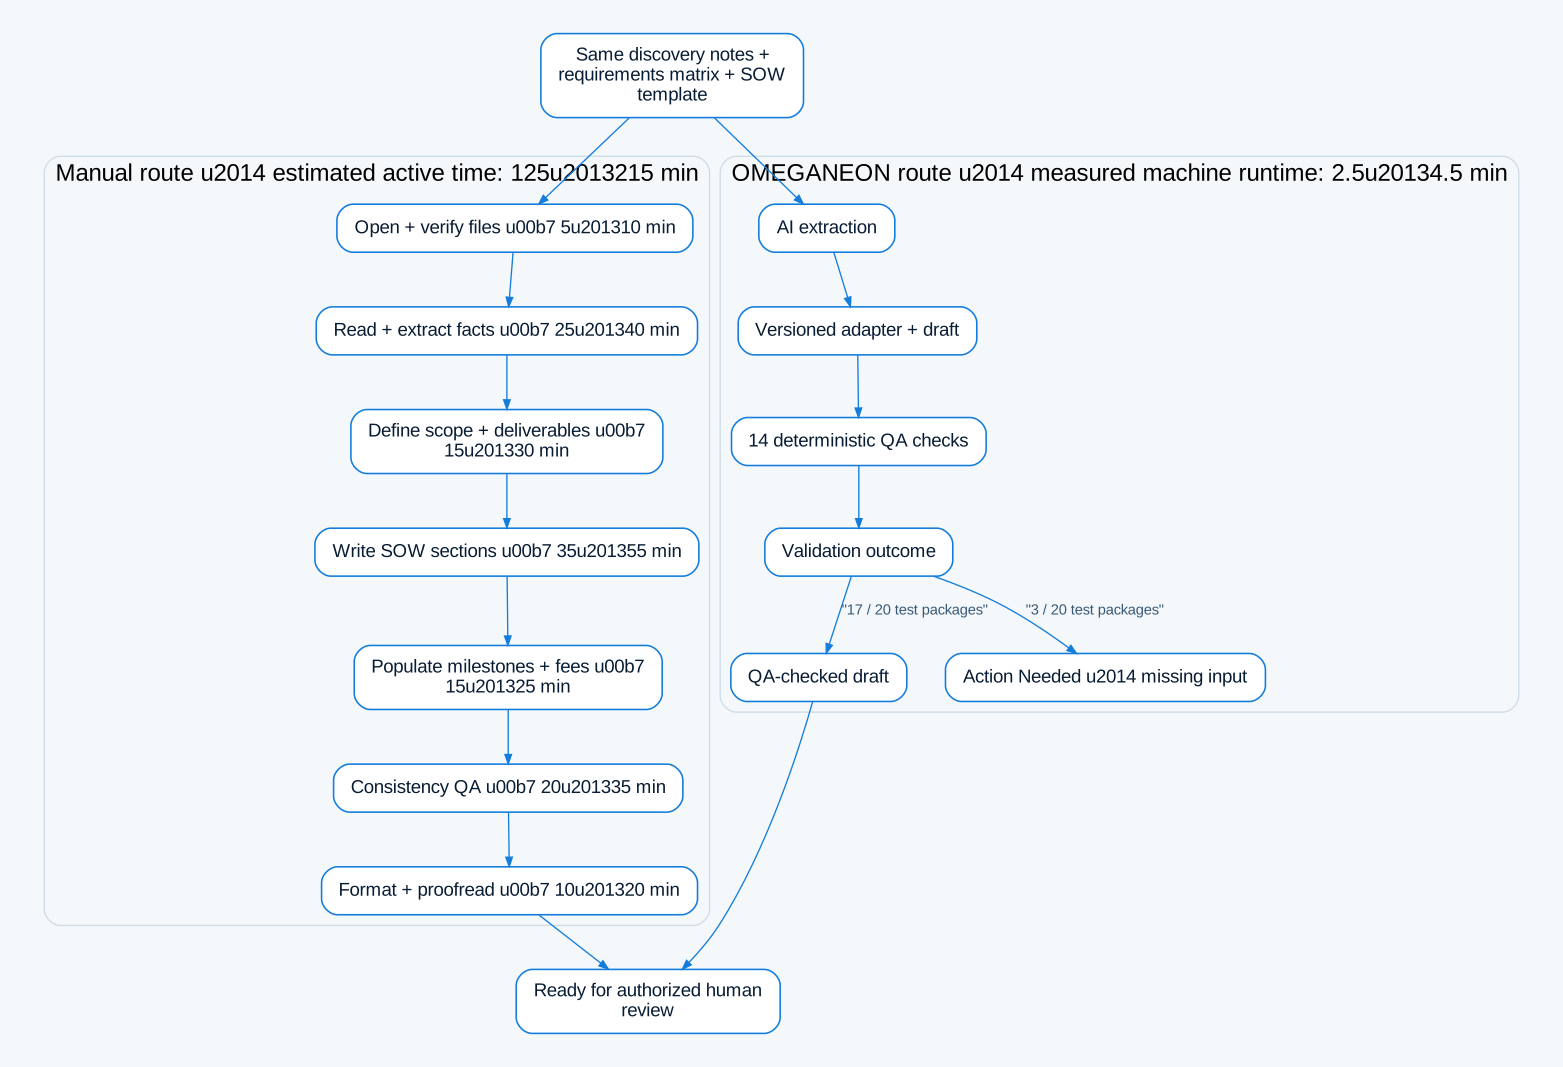
Open full workflow diagram
Comparison Scope
Evidence classification: The manual figure is a scenario-based task estimate, not an observed industry average. The automated Draft + QA figure is a measured sandbox runtime. Because the automatic workflow also requires human handling and can enter exception paths, the difference between these two figures is not measured net labor savings or end-to-end delivery time. The model will be revised when same-scope manual timings become available.
6.4 — First-Pass Validation
85% — 17 of 20 test packages
Seventeen document packages passed initial validation. Three were correctly routed to Action Needed because required source information was missing.
The exception cases demonstrate the workflow's ability to enforce input requirements during document production.
6.5 — Deterministic QA Enforcement
14 active validation checks
The QA layer evaluates defined document requirements before delivery. AI provides flexible language processing; deterministic checks enforce explicit rules and route invalid or incomplete outputs for correction.
6.6 — Observed Inference Cost
$0.25–$0.65 per document package
Recorded OpenRouter API costs cover the AI inference stages involved in producing document packages, including multi-step extraction, drafting, and correction activity.
Cost scope: API inference spending. Human review, infrastructure, and other operating expenses are separate components of full-service unit economics.
6.7 — Operational Scorecard
The sandbox benchmark supplies the initial engineering verification record; managed operations track full-lifecycle performance separately.